Analysis of the Core Factors Affecting the Operational Performance of Energy Storage Power Stations
2025-11-26

In the construction of modern power systems, energy storage power plants serve as a crucial hub for the coordination of generation, grid, load, and storage. Their operational performance directly determines the actual value of grid peak shaving and frequency regulation, renewable energy integration, and user-side cost optimization. The four core indicators — equipment availability, operational efficiency, depth of discharge (DOD), and battery capacity degradation rate — measure the “availability, economy, safety, and longevity” of energy storage plants. Availability determines “how long it can run” (full-power continuous operation duration), efficiency determines “how well it runs” (energy utilization), DOD affects “how far it can run in a single cycle” (single-cycle output capacity), and degradation rate concerns “how many years it can run” (long-term service life). This article examines these four indicators, analyzes their key influencing factors, and proposes optimization directions based on industry practice, providing a reference for operational management and equipment selection of energy storage plants.
1. Equipment Availability: The Foundation of Plant “Usability”
Equipment availability refers to the proportion of time an energy storage plant can actually be used during its planned operating periods. It is the prerequisite for ensuring plant revenue. For example, in a 200MW/400MWh standalone energy storage plant, every 1% drop in availability can result in an annual charge/discharge loss of up to 1,200 MWh. Its core influencing factors can be summarized into three dimensions: equipment stability, maintainability, and flexible redundancy mechanisms.
| Equipment Option | Annual Availability | Annual Downtime |
Annual Revenue Loss
(200MW/400MWh system, electricity price $0.0523/kWh)
|
|---|---|---|---|
| Standard Equipment (Industry Average) | 95% |
438 h
|
US $254,000 |
| High-Stability Equipment | 99% |
88 h
|
US $50,800 |
| Revenue Difference | +4% | –350 h | +US $203,000 / year |
(1).Equipment Stability: The “Innate Basis” of Availability
The quality of core equipment in energy storage plants — PCS, battery packs, EMS systems, and fire protection devices — directly determines the lower limit of availability. Key performance parameters and design standards form a “stability barrier.”
The productization of energy storage systems and modularization of key components are central to equipment stability. PCS hardware redundancy and protection, battery pack consistency and structural design, rational thermal management and temperature control, EMS response speed and fault tolerance, and multi-level fire protection design all require specialized, systematic optimization to ensure reliability and stability.
The productization of energy storage systems and modularization of key components are central to equipment stability. PCS hardware redundancy and protection, battery pack consistency and structural design, rational thermal management and temperature control, EMS response speed and fault tolerance, and multi-level fire protection design all require specialized, systematic optimization to ensure reliability and stability.
(2). Equipment Maintainability: The “Acquired Guarantee” of Availability
The ease of maintenance and repair directly affects fault recovery time. Each hour saved in repair time can reduce energy loss by approximately 66 MWh for a 200MW/400MWh plant. The core factor here is the “operation and maintenance friendliness” of the equipment design.
Key points include modular and standardized design, accuracy of fault diagnosis, and availability of spare parts. These ensure fewer offline events, shorter downtime, lower repair costs, and faster recovery, thereby maximizing overall online operation duration and minimizing energy loss.
Key points include modular and standardized design, accuracy of fault diagnosis, and availability of spare parts. These ensure fewer offline events, shorter downtime, lower repair costs, and faster recovery, thereby maximizing overall online operation duration and minimizing energy loss.
(3). Flexible Redundancy Mechanisms: The “Elastic Safety Net” of Availability
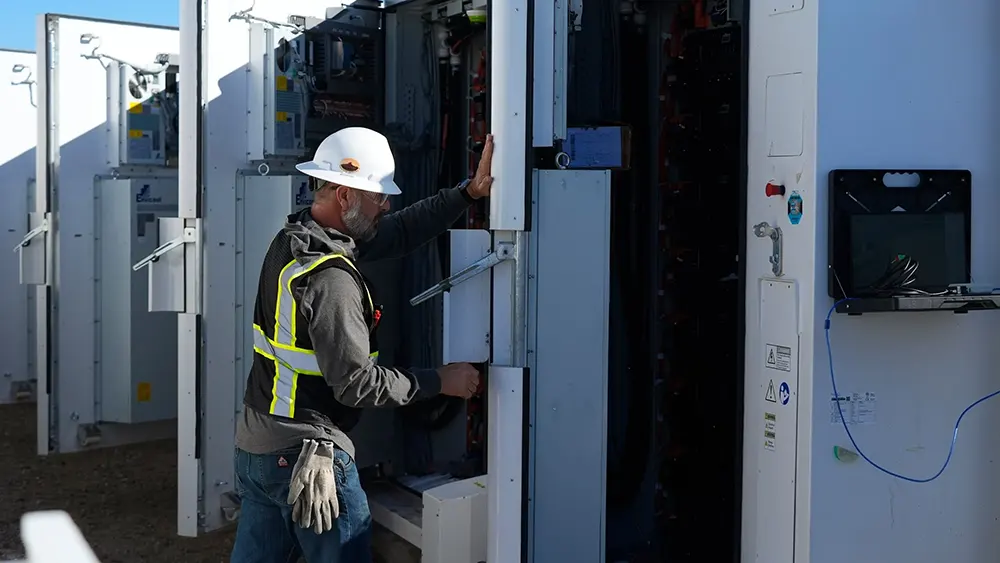
When a single device or battery cluster fails, redundancy at the equipment level can prevent plant-wide or partial shutdowns, serving as the “last line of defense” for high availability. The core lies in “critical equipment redundancy plus automatic load transfer.”
By reducing the control granularity of individual loops, staggered calibration of single devices, and off-peak maintenance, plants can maintain maximum effective power output and improve peak shaving and frequency regulation response rates.
By reducing the control granularity of individual loops, staggered calibration of single devices, and off-peak maintenance, plants can maintain maximum effective power output and improve peak shaving and frequency regulation response rates.
2. Equipment Operational Efficiency: The Core of Plant “Economics”
Equipment operational efficiency refers to the full-cycle energy conversion efficiency of an energy storage plant, from charging from the 110kV grid to discharging back to the 110kV grid. Each 1% improvement can increase annual revenue by approximately 83,333 USD (for a 200MW/400MWh plant, assuming a spot electricity price of 0.0556 USD/kWh). The key influencing factors are concentrated in three main areas: energy conversion, thermal management, and system coordination.
| Key Equipment Index | Industry Average Efficiency | Leading Solution Efficiency | Annual Revenue Increase for 400 MWh *(vs. industry) |
| DC Conversion Efficiency | 94% | 95% | +US $84,700 |
| PCS Conversion Efficiency | 97.20% | 98.50% | +US $110,100 |
| Thermal Management System Energy Consumption | 3.00% | 1.80% | +US $101,700 |
| 690V–110 kV Step-Up System Efficiency | 97.00% | 98.00% | US $84,700 |
| Output Cable Loss | 1% | 1% | 0 |
| System Overall Efficiency | 85.00% | 89.00% | +US $338,900 |
(1). Energy Conversion Stage: The “Primary Source” of Efficiency Loss
Energy conversion in an energy storage system involves eight steps: grid → transmission line losses → step-down → PCS → battery → PCS → step-up → transmission line losses → grid. Losses at each step are determined by equipment performance and system design, with total losses typically accounting for 10%-15% of the input energy.
Battery charge/discharge losses differ significantly between first-line and second-line cells, with efficiency differences exceeding 1%. The PCS is the core of energy conversion, and its topology (two-level vs three-level), power devices (IGBT vs SiC), and operating conditions (load rate) determine conversion efficiency. Under rated load (100%), a three-level PCS using the minimal switching vector algorithm can achieve 98.5%-99% conversion efficiency, improving by 1.5 percentage points compared with a two-level PCS (97%-97.5%). The combined conversion losses of battery + PCS + transformer are relatively fixed components of system efficiency.
Battery charge/discharge losses differ significantly between first-line and second-line cells, with efficiency differences exceeding 1%. The PCS is the core of energy conversion, and its topology (two-level vs three-level), power devices (IGBT vs SiC), and operating conditions (load rate) determine conversion efficiency. Under rated load (100%), a three-level PCS using the minimal switching vector algorithm can achieve 98.5%-99% conversion efficiency, improving by 1.5 percentage points compared with a two-level PCS (97%-97.5%). The combined conversion losses of battery + PCS + transformer are relatively fixed components of system efficiency.
(2). Thermal Management System: The “Invisible Regulator” of Efficiency
Thermal management losses (energy consumption of liquid-cooling units and fans) account for 2%-4% of total system losses, yet most projects overlook their impact on efficiency. The equipment design, configuration, and thermal management strategy directly determine these losses. For the same liquid-cooling unit and installed capacity, the difference between fixed-temperature strategies and dynamic multi-factor decision thermal management strategies can exceed 30%, corresponding to a system efficiency difference of over 1.5%.
(3). System Coordination: The “Efficiency Amplifier”
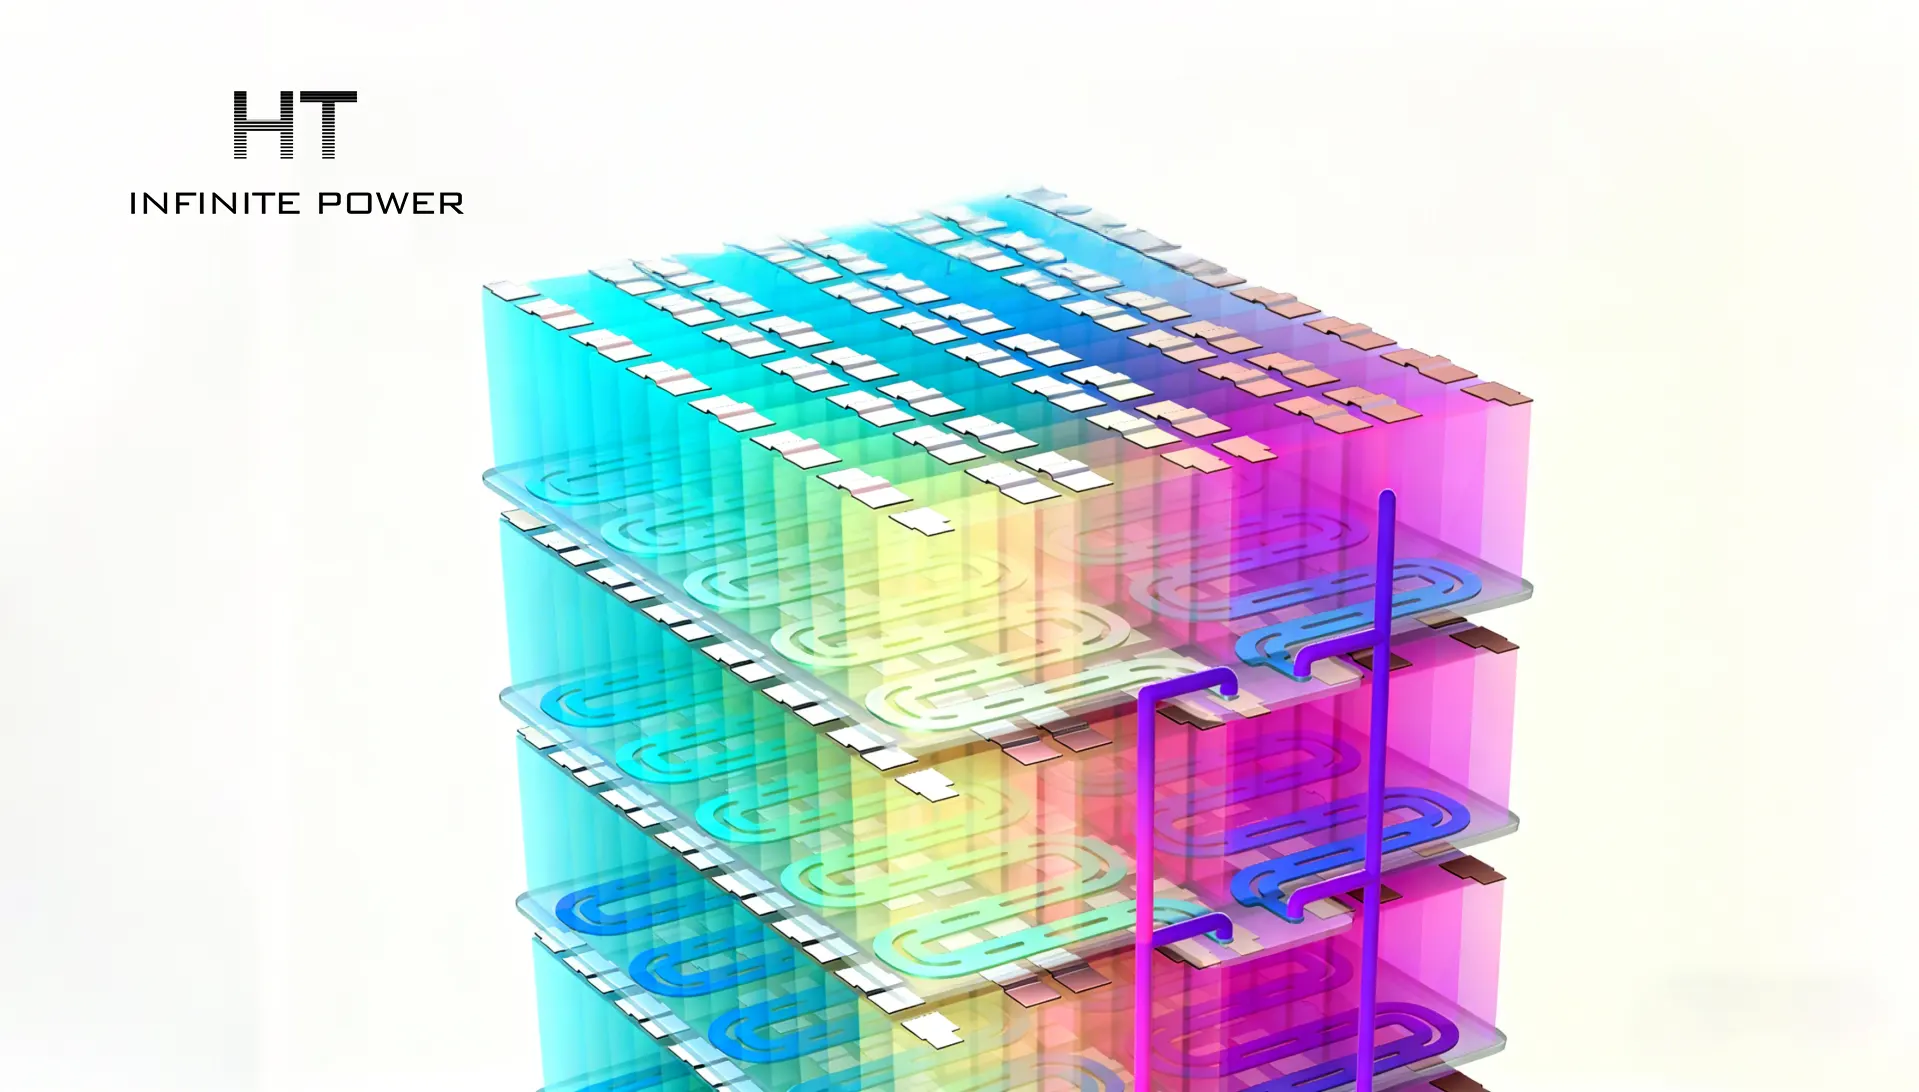
The coordination between PCS, battery systems, BMS, and EMS directly affects overall efficiency. The core of coordination lies in the compatibility between components and control logic.
For example, aligning the battery DC-side operating voltage range with the PCS’s optimal efficiency range is the fundamental factor for achieving high PCS conversion efficiency. When the PCS operates within or outside its “comfortable” voltage range, efficiency differences can exceed 3%, directly impacting overall system efficiency.
For example, aligning the battery DC-side operating voltage range with the PCS’s optimal efficiency range is the fundamental factor for achieving high PCS conversion efficiency. When the PCS operates within or outside its “comfortable” voltage range, efficiency differences can exceed 3%, directly impacting overall system efficiency.
3. Depth of Discharge (DOD): The “Control Knob” for Single-Cycle Output
Depth of discharge (DOD) refers to the ratio of the battery’s actual charged/discharged capacity to its rated capacity (e.g., DOD = 90% means 90% of the rated capacity is discharged). It directly affects the single-cycle peak-shaving capability of a plant — if DOD drops from 90% to 80%, a 400MWh plant’s single-cycle discharge energy will decrease by 40MWh. The ability to support higher DOD represents the ultimate expression of a plant’s single-cycle output. Its influencing factors must be analyzed comprehensively in relation to battery characteristics, system topology, and control protections.
| Topology | DOD Support Range | Single-Cycle Discharge Capacity |
Annual Revenue Increase
* (vs. DOD 90%)
|
| Optimized Cluster Topology | 98% | 8.00% | +US $ 487,000 |
| Standard Cluster Topology | 95% | 5.00% | +US $ 241,500 |
| Traditional Cluster Topology | 90% | 0% | Baseline |
| Performance Difference | 8% | 8.00% | +US $ 487,000 |
(1). Battery Characteristics: The “Physical Limit” of DOD
Common lithium iron phosphate (LFP) batteries used in energy storage can achieve over 7,000 cycles at DOD = 95% while maintaining capacity retention ≥70%. However, if cells are operated outside their safe voltage range for extended periods, overcharge or over-discharge accelerates degradation, and cycle life may decrease by up to 40%.
(2). System Topology: The “Artificial Support” for DOD
System topology determines how energy is distributed across battery packs. A well-designed topology can prevent inter-pack circulating currents and avoid local overcharge or over-discharge, supporting higher DOD. For example, traditional centralized topologies with multiple packs connected in parallel may set charge/discharge limits at 5%-95% (DOD = 90%) to prevent inter-pack circulation issues at the ends of the cycle. In contrast, string-based topologies with individually managed packs, independent AC outputs, and no inter-pack circulation, combined with appropriate protection mechanisms, can achieve DOD exceeding 98% without adversely affecting battery degradation.

(3). Control and Protection: The “Safety Net” for DOD
Even when battery characteristics and system topology support high DOD, inadequate control and protection can still cause equipment damage. Therefore, the precision and response speed of control protections constitute the safety net for high DOD operation. Achieving fast and accurate protection requires high standards for the three protection systems of the energy storage plant (BMS, PCS, EMS). The degree of integration and the alignment between monitoring, control, and execution critically determine protection success. Selecting a fully integrated 3S (BMS+PCS+EMS) in-house developed system with fused control and protection functions is an effective way to minimize the risk of batteries operating outside their normal range.
4. Battery Capacity Degradation Rate: The Key to Plant “Longevity”
Battery capacity degradation rate refers to the ratio of (initial capacity – actual capacity) to the initial capacity after repeated cycles (e.g., after 1,000 cycles, capacity retention is 90%, degradation rate is 10%). It directly determines the “lifecycle revenue” of an energy storage plant — for every 1% reduction in annual degradation rate, the plant’s total lifecycle revenue can increase by several million USD. The cumulative effect becomes more pronounced over time. The core influencing factors focus on three dimensions: temperature, cycle count, and cell performance.
|
First-year Capacity Retention
(1 cycle/day)
|
Capacity Retention at 7,000 Cycles |
First-year Revenue Difference
(400 MWh, 0.0417 USD/kWh)
|
Lifetime Revenue Difference
(400 MWh, 0.0417 USD/kWh)
|
| Industry Average: 98% | 70% | US $50,000 | US $2,500,000 |
| Premium Equipment: 98% | 60% |
(1). Operating Temperature: The “Primary Killer” of Degradation
Temperature affects battery degradation in an exponential manner:
- Ideal condition (25℃): LFP batteries exhibit approximately 10% degradation after 1,000 cycles, and can retain 70% capacity after 7,000 cycles.
- High-temperature condition (45℃): In some installations, insufficient air-conditioning capacity or high activation temperature causes battery operation between 35–39℃ for extended periods. Under such conditions, degradation after 1,000 cycles rises to 15%, and after 7,000 cycles, only 60% of capacity remains.
- Low-temperature condition (-10℃): Battery activity declines, charging efficiency decreases, and forced charging may lead to lithium dendrite formation, accelerating degradation.
(2). Cycle Count and Intensity: The “Cumulative Effect” of Degradation
The cumulative effect of cycle count and charge/discharge intensity is the primary driver of battery degradation. The equipment’s charge/discharge control capability and C-rate adaptability can mitigate this accumulation.
- Cycle count: For LFP batteries, each additional 1,000 cycles leads to about 8%-12% degradation (depending on temperature). As cycle counts increase, systems with different degradation rates diverge more in usable capacity over time, amplifying differences in lifecycle energy throughput. Therefore, controlling degradation on every single cycle is essential for ensuring long-term high returns.
(3). Cell Quality and Consistency: The “Innate Differences” in Degradation
Cell consistency and material stability directly influence overall degradation rates:
- First-tier cells: consistency differences ≤0.3%, degradation variance within 0.5%, maintaining uniform degradation across the plant and minimizing the “weakest link” effect.
- Second-tier cells: consistency differences >1%, degradation variance >2%. As cycle counts increase, inconsistencies accumulate, exacerbating the “weakest link” effect, sharply reducing the plant’s usable capacity and adversely affecting operational performance.
5. Coordinated Optimization of the Four Key Metrics: From “Individual Improvement” to “System-Wide Optimization”
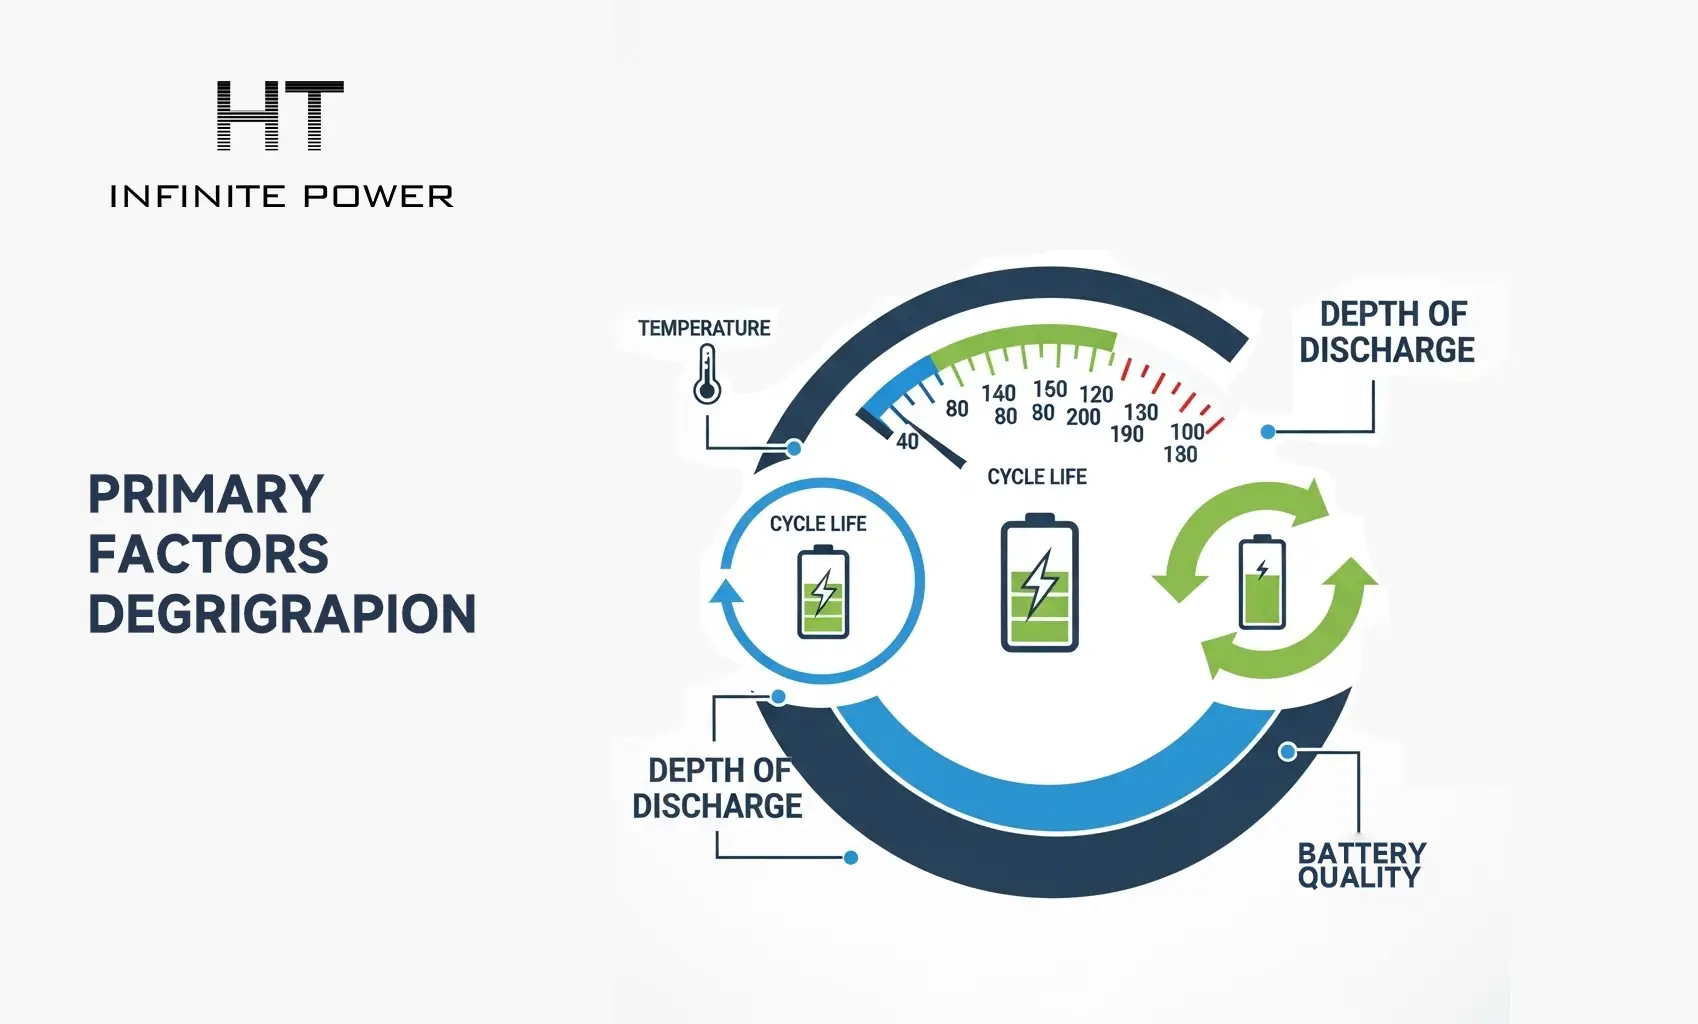
It should be noted that the four key metrics are not independent — overemphasizing one may adversely affect the others. For example, increasing battery temperature to improve operational efficiency can accelerate capacity degradation. Likewise, raising the depth of discharge without proper control protection and battery management may shorten cycle life and reduce the online rate. Therefore, achieving overall system optimization requires a “coordinated, holistic approach” across all metrics.
Conclusion
The operational performance of an energy storage plant is the result of the combined effects of four key metrics: online rate, efficiency, depth of discharge, and capacity degradation. Optimizing these metrics requires a full lifecycle approach encompassing equipment selection, operation, and maintenance — avoiding both “cost-cutting compromises” and “sacrificing long-term performance for short-term gains” (such as operating at excessive temperatures).
Looking ahead, with the implementation of improved electrical topologies, advanced thermal management, and better cell technologies, energy storage plants are expected to achieve targets such as high online rates (≥99.9%), high efficiency (≥90%), deep DOD (≥95%), and low annual degradation (≤4%), providing more stable and economical support for modern power systems.
For investors and operators, understanding the principle that “equipment value determines operational performance, and operational performance determines long-term returns” is essential. Selecting manufacturers with integrated design capabilities is a key factor in realizing profitable energy storage projects.
Latest Trends in Large-Capacity Energy Storage Cells
AGC vs. AVC Explained: Differences, Control Mechanisms, and the Role of Energy Storage